Project Dashboard With Key Requirements Metrics
Configure project dashboards to display key requirements related metrics and KPIs. Use the built-in wizard to generate counter or chart widgets easily. Customize the widget directly in the template code.
Dashboard Widgets
Requirements serve as a key indicator for measuring project status, providing insight into how much of the work still needs to be done. With the project dashboard, you can visualize current requirements metrics vital for effective project management and continuous improvement of requirements quality:

The dashboard consists of widgets placed in a grid. There are several typical types of dashboard widgets:
- Text: shows a description or other important information about the project.
- Counter: displays the total number of user needs, functional requirements, test cases, or risks. These numbers are useful for comparing projects by their complexity.
- Chart: visualizes the number of requirements aggregated by status, priority, or other custom attribute. This provides a clear overview of requirement status tailored to your specific workflow.
- Table: highlights project items that need special attention, e.g., requirements with unresolved comments from reviewers.
- Coverage: displays the percentage of high-level requirements satisfied by lower-level requirements, or the percentage of requirements verified by test cases. These metrics indicate potentially missing design or verification, or gaps in requirements traceability. These issues needs to be addressed to improve overall requirements quality.
Widget Wizard
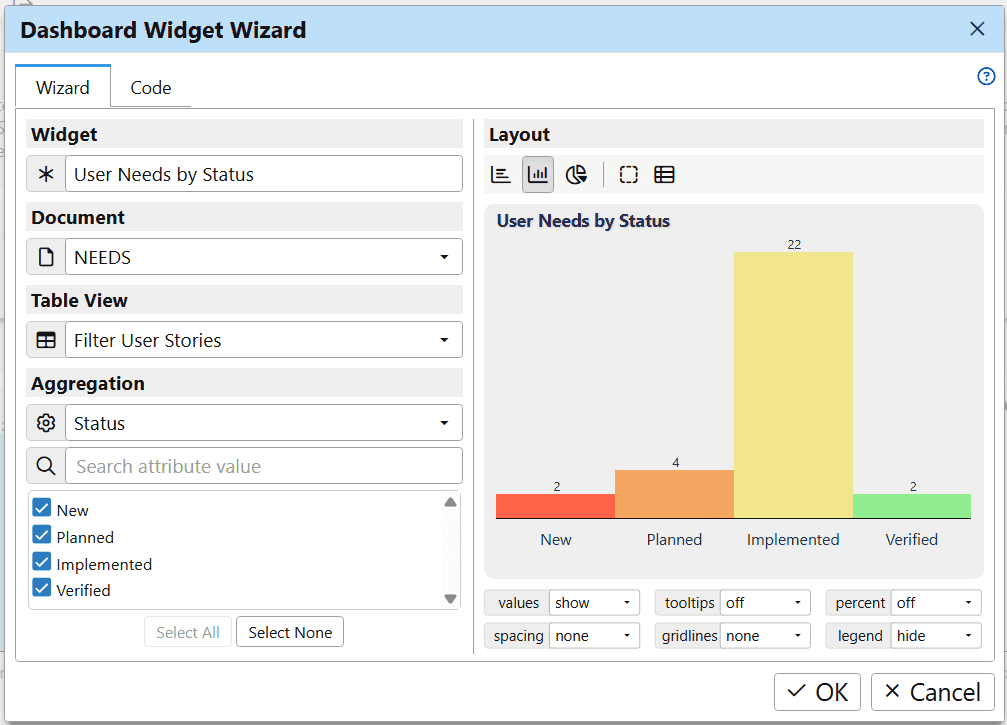
You can create Counter and Chart widgets easily using a wizard:

On the left side of the wizard, configure the widget data source:
- Widget: enter the widget name displayed at the top.
- Document: choose the document storing data.
- Table View: optionally, select a table view to filter document data.
- Aggregation: choose a custom attribute to group document objects and select displayed values of the attribute.
On the right side of the wizard, select a widget layout and see an instant preview of the widget. Under the preview, you can adjust several display options.
Once generated, you can reposition or resize widgets directly on the dashboard. You can also fully customize their output in HTML template code.
Widget Code
You can configure Text, Coverage, and other types of widgets using HTML template code:

For more information about template code, see Export Using Custom Templates.
Conclusion
ReqView project dashboards help system engineers and project managers monitor project health through customizable, visual metrics. Dashboards can be tailored to specific needs using either the built-in wizard or direct template code modification.