Manage Requirements Better Than in Excel
Using Excel as a requirements management tool can be a big pain. See how ReqView can help you with managing requirements and a traceability matrix.
Table of Contents
- Introduction
- Business Requirements
- High Level Requirements
- Detailed Requirements
- Traceability Matrix in ReqView
- Conclusion
Abstract
Customers managing requirements for complex HW/SW products in Excel are often facing many problems. One of the main challenges is to maintain consistent traceability links. We will show how you can solve these issues in ReqView.
For the purpose of this blog post, we have adopted a fictitious case study developed by Dan Tasker and published in the Trips-R-You Web-based Flight Reservation System Case Study article. The case study captures requirements for a web-based Flight Reservation System in MS Excel spreadsheets.
We will demonstrate that you can handle the same information in ReqView and take advantage of powerful requirements management features.
Introduction
The case study describes a business information system, which maintains business-related data within a database management system (DBMS) and adds capabilities to:
- User Interfaces (UIs) — give online access to the stored data
- Reports — contain data stored in the system for referencing offline
- Imports — store data made available by another system
- Exports — store data for use by another system
- Automated Functions — create new data within the system based on data currently stored in the system
The case study uses three types of requirements for the above functionalities:
- Business Requirements — overview the problem and state business goals to be achieved
- High-Level Requirements — determine the chosen solution context and identify user needs (stakeholder requirements)
- Detailed Requirements — specify UI, report, data import, export, or automated function capabilities, and the data dictionary
Business Requirements
We imported business requirements from the case study in document INFO structured as follows:
- Problem / Opportunity — overview the business case and state the problem to solved
- Chosen Solution — investigate potential solutions and explain reasons for the chosen solution
- Goals — set business goals
High-Level Requirements
We imported high-level requirements from the case study in document NEEDS structured as follows:
- Scope — determine the chosen solution context by stating your assumptions, functionality in / out of scope, and draw a system context diagram
- High-Level Requirements — specify user needs (stakeholder requirements)
- Constraints — describe the constraints on design of the solution
- Concept Model — model data entities
The following screenshot shows the table of contents of NEEDS document and the imported context diagram:
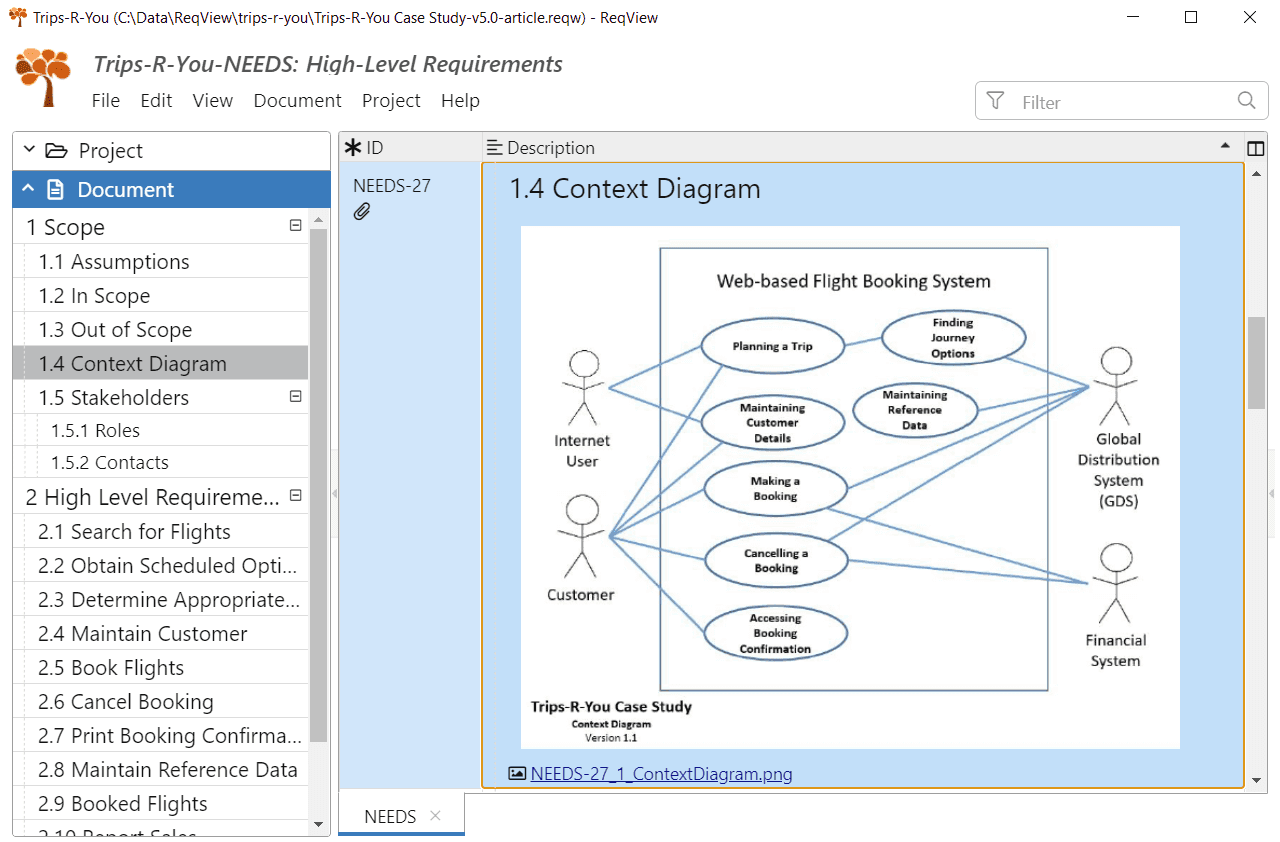
The case study stores diagrams in a separate Excel tab so users need to make an extra effort to manually locate each diagram. In ReqView, diagrams are attached as images directly into document sections allowing users to see diagrams in the right context.
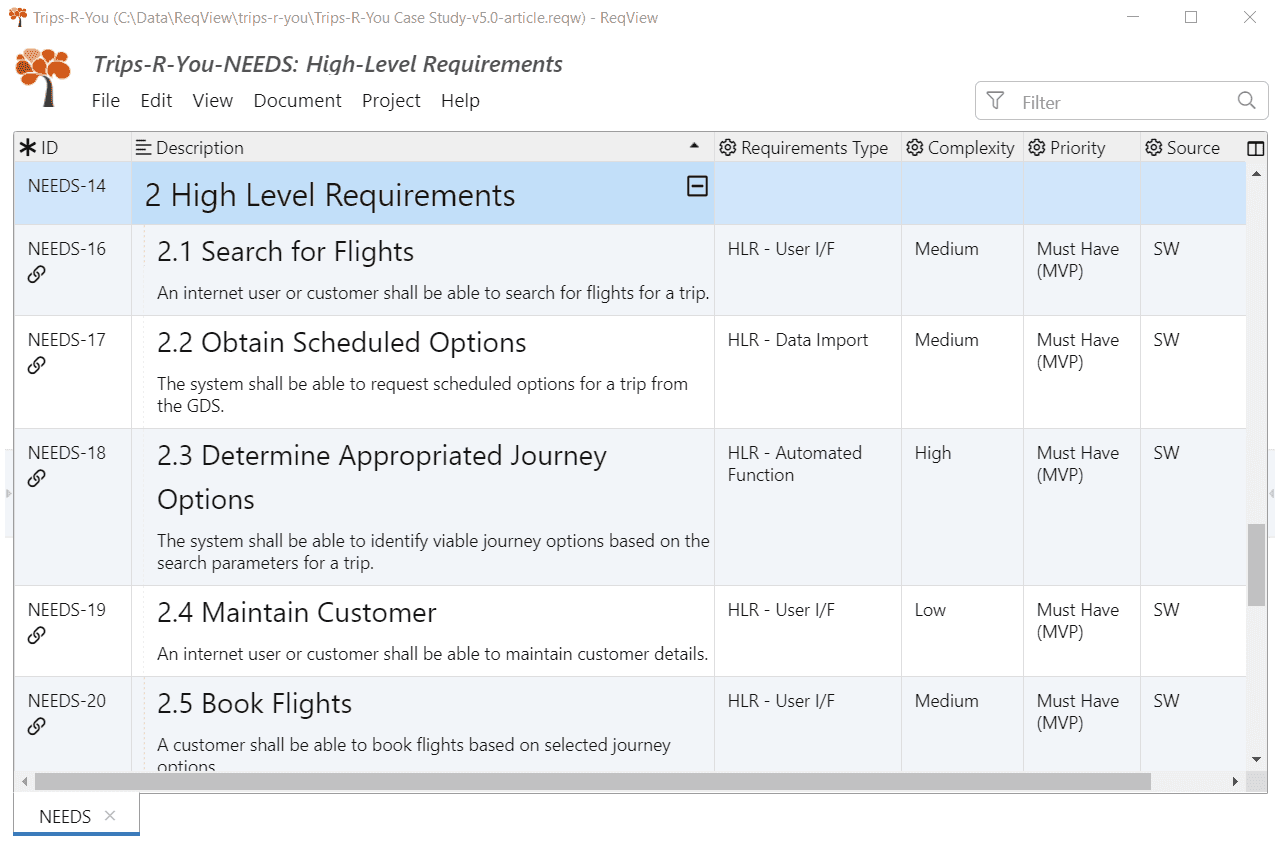
We imported text descriptions of high-level requirements into the Description column in ReqView. Note that text descriptions in ReqView can include rich text format including bullet and numbered lists, code paragraph style and URL links, which are not supported by Excel.
Additional Excel columns capturing category, complexity, priority, source, responsibility, and risk of high-level requirements are imported as custom attributes. ReqView validates values of custom attributes based on their type (string, text, number, date, etc.).
The following screenshot shows how the imported high-level requirements are displayed in ReqView:
Detailed Requirements
The case study describes detailed requirements in a tabular form, which has some advantages compared to the traditional approach with formally stated textual requirements using shall / should form. The main advantage is that organization of related information in columns avoids repeating of boilerplate texts, increases requirements consistency, and allows users to filter relevant information when reviewing the document.
We imported detailed requirements into the following documents according to their type:
- DD — data processing requirements describing how data are persisted (typically in an SQL database), validated, and derived
- UI — user interface requirements specifying what a user sees on the screen and how they can operate the system
- REPORTS — requirements for visual outputs to be shared with other users or printed
- IMPORT — requirements for importing data from other systems
- EXPORT — requirements for exporting data to other systems
- AUTO-F — requirements for automated functions processing data without user involvement
We explain how DD and UI documents store information imported from the example spreadsheets in the next sections. The other documents are structured very similarly. Please download the example ReqView project to learn more about the content of these documents.
Data Dictionary
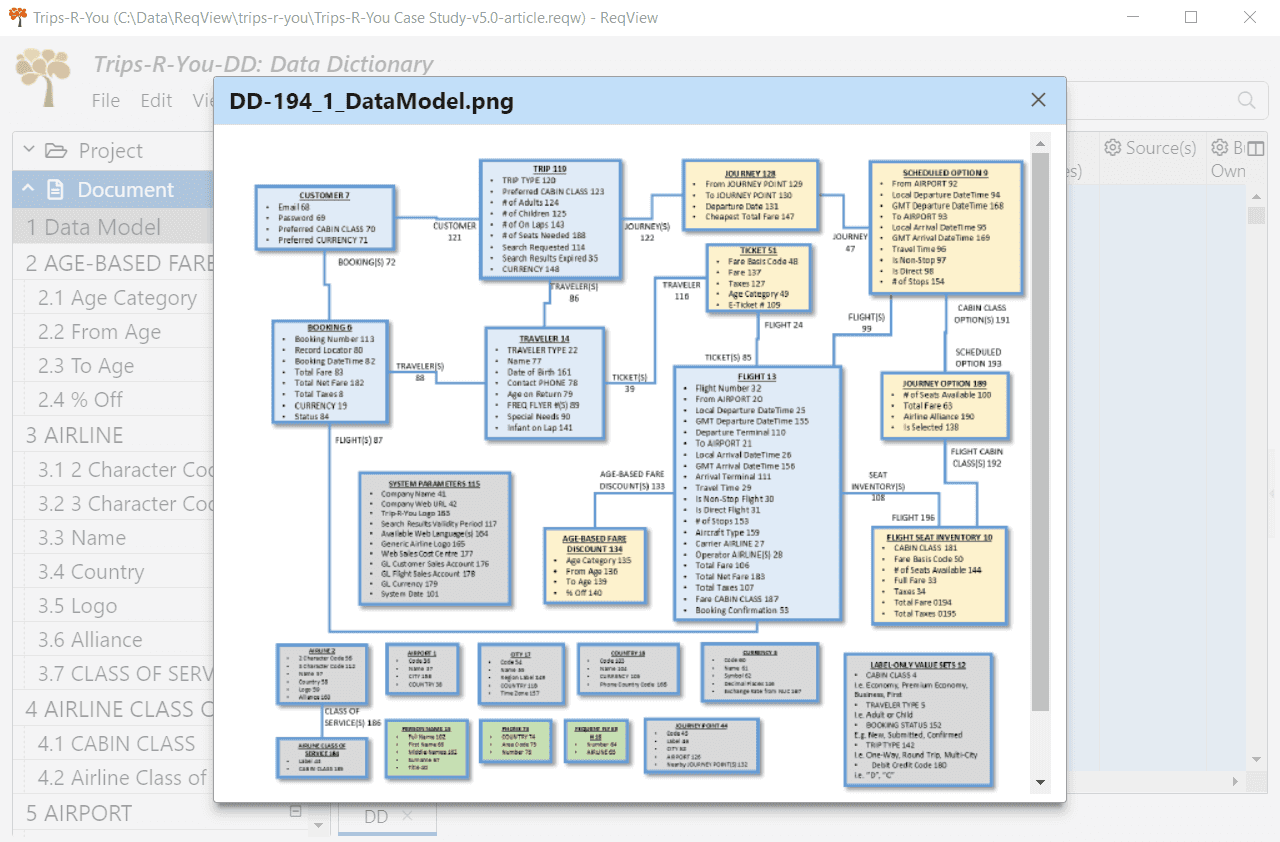
Document DD starts with a visual representation of the data schema stored in the section “Data Model”:
Then, it lists entries from the data model organized by records and their fields, and sorted alphabetically. The following screenshot illustrates the primary record “CUSTOMER” containing two fields “Email” and “Password”:
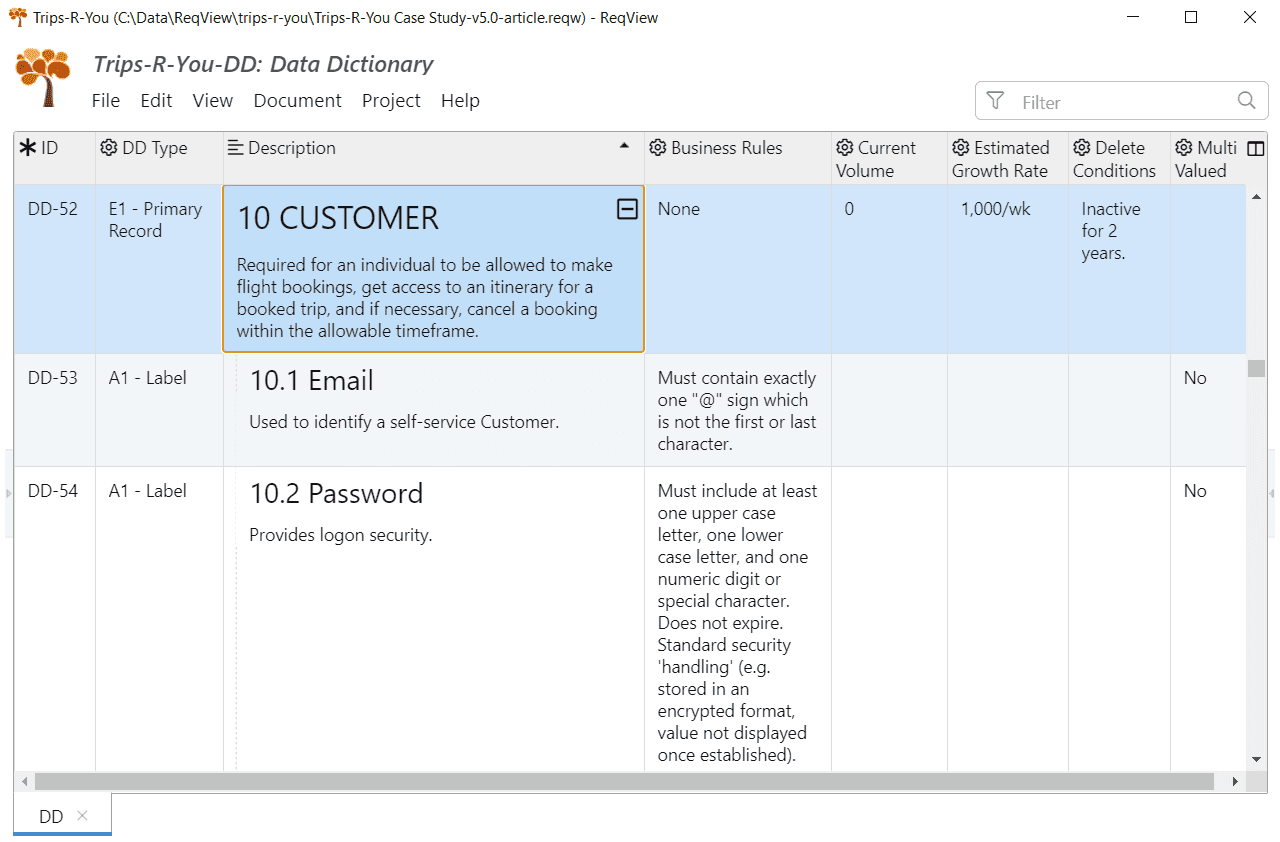
Note the columns capturing additional details for the selected primary record — that we estimate around 1k new customer records per week, and that retention of customer records is 2 years of inactivity.
User Interface
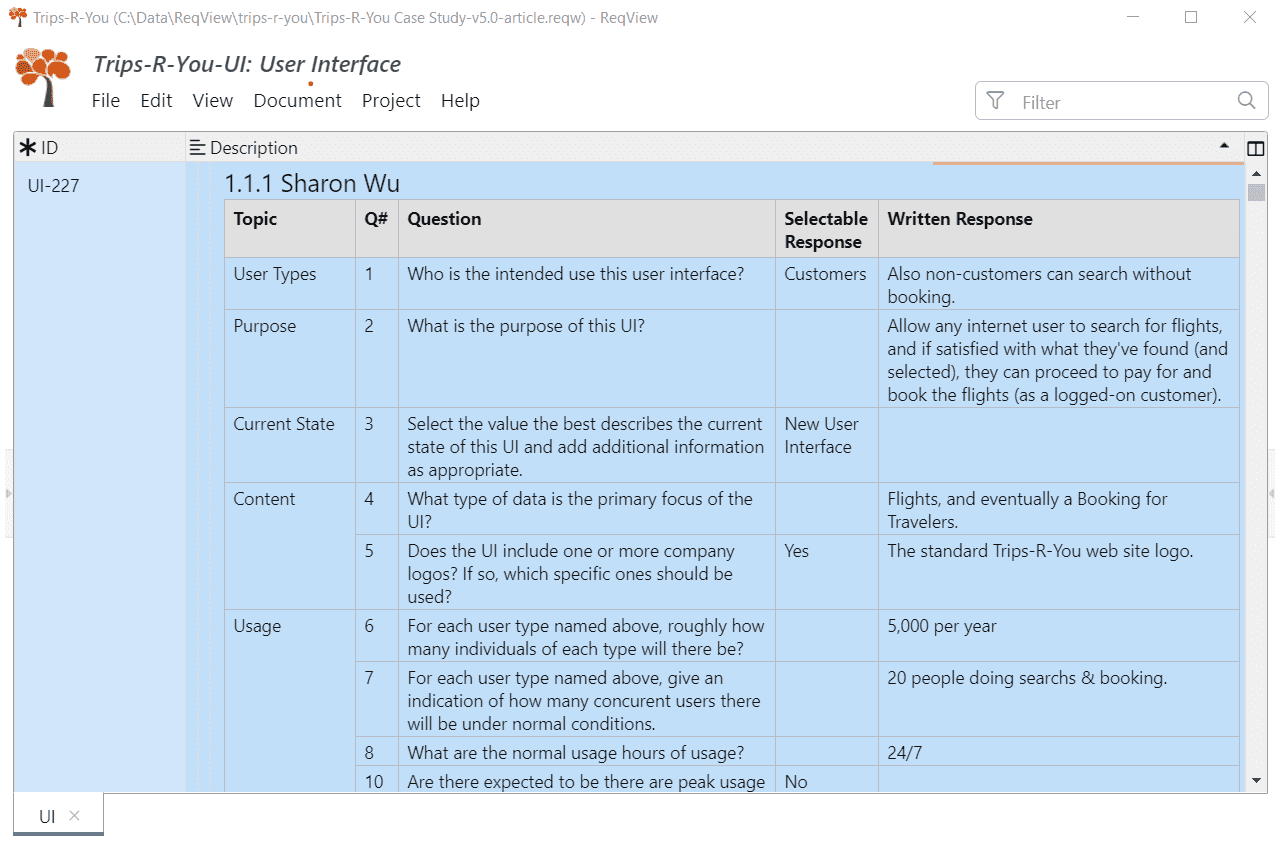
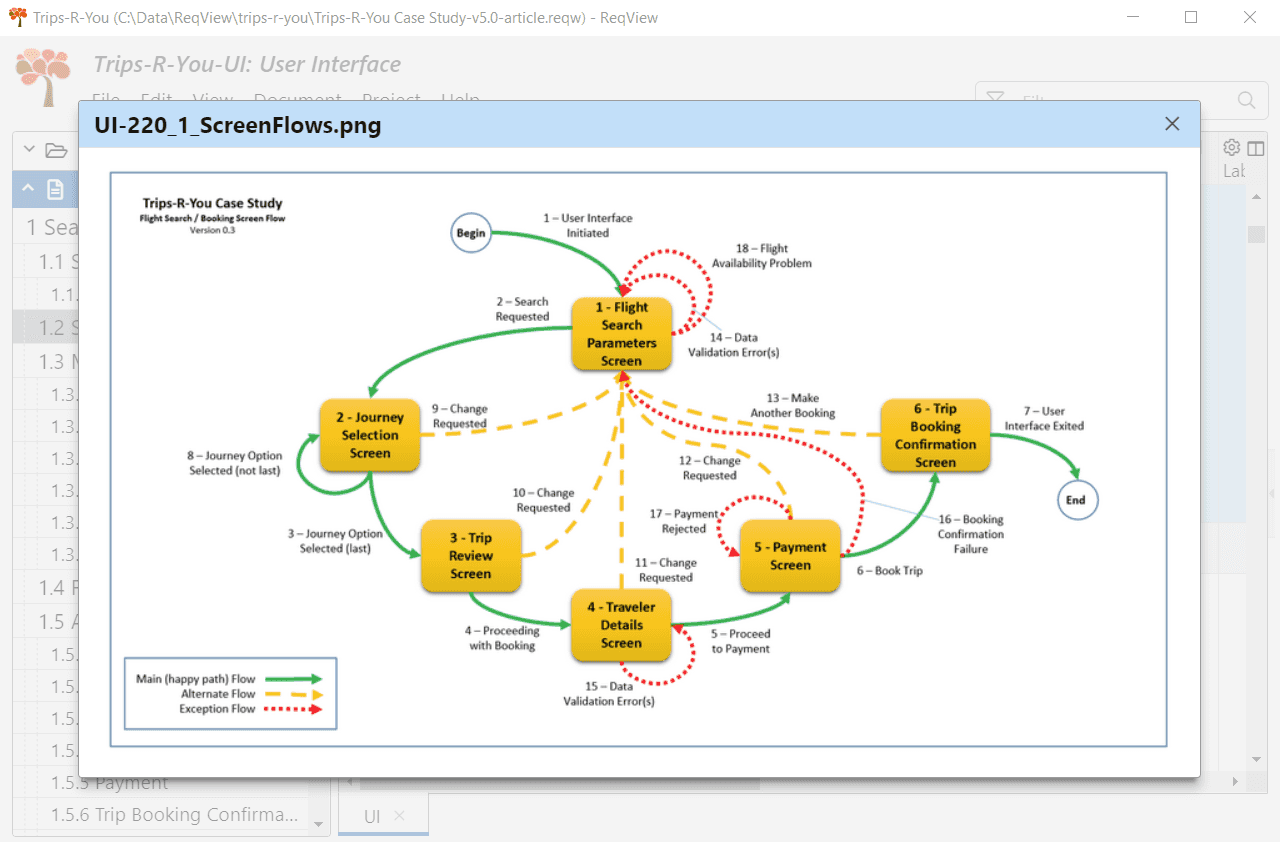
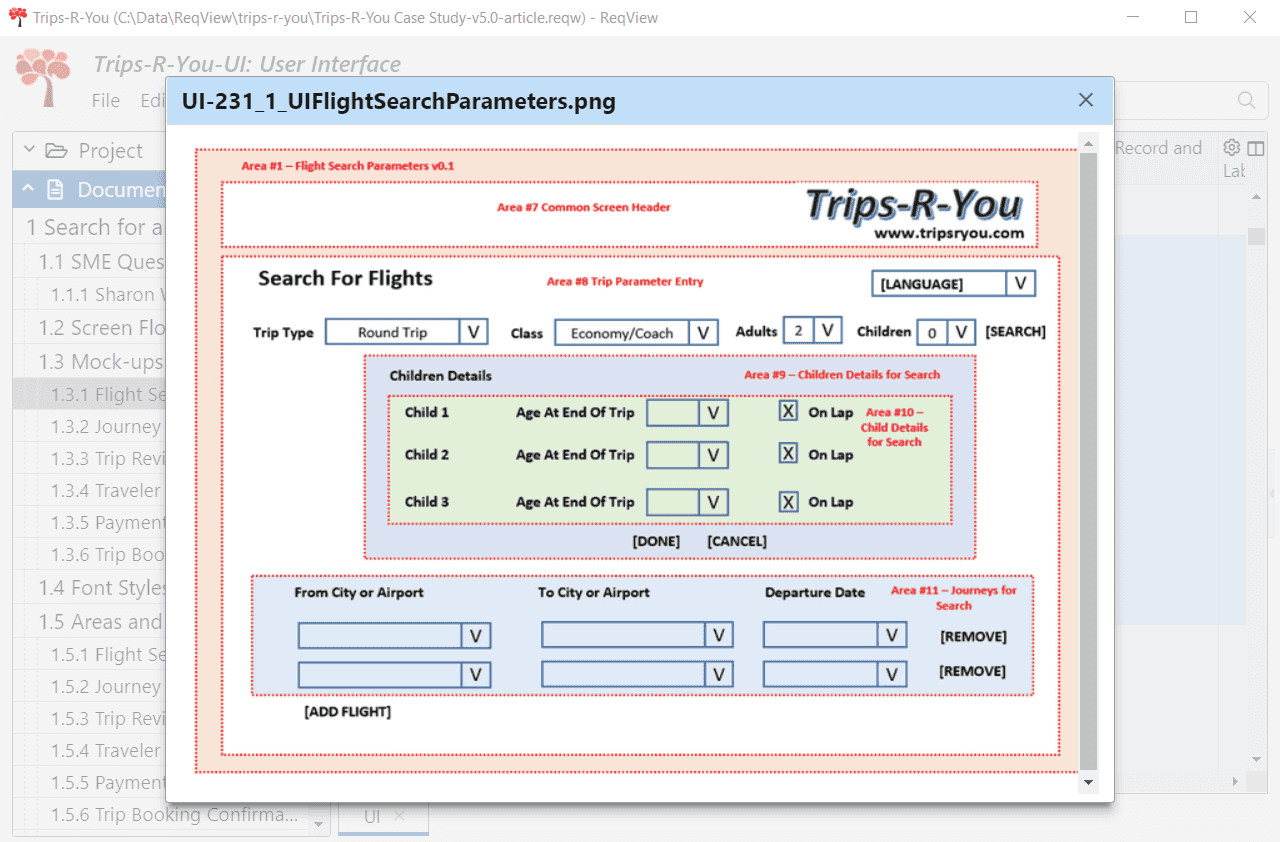
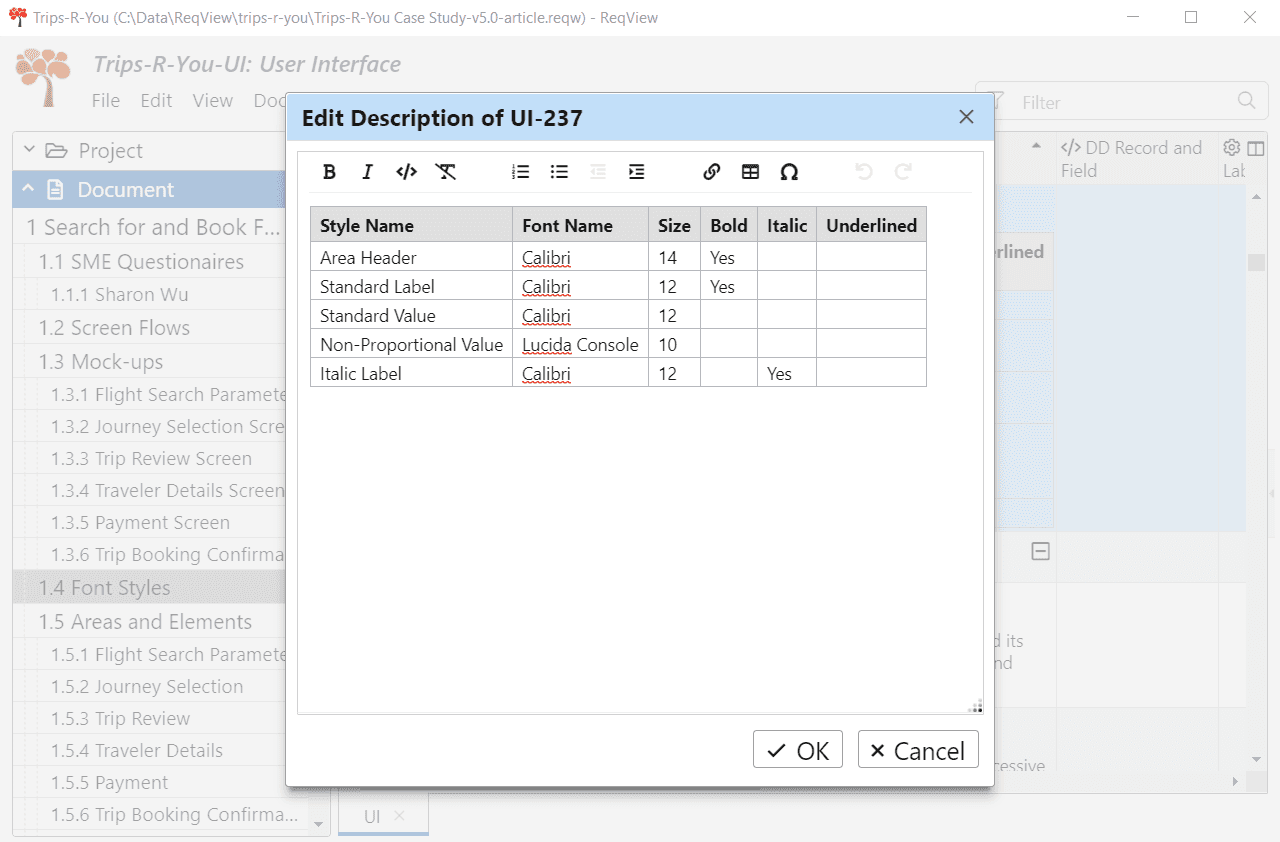
Document UI is organized by user scenarios at the top level. For each user scenario, the corresponding section provides necessary information about Subject Matter Expert (SME) questionnaires, screen flow diagrams, screen mock-ups, information of font styles and a list of screen areas and their elements.
SME questionnaires can be attached as external documents, linked by a URL, or copied from Word or Excel as embedded tables. We chose the last option to display them directly in the Description column:
Screen flow diagrams visualize the main, alternate and exception flow through the scenario:
Visual mockups of the user interface are essential for understanding how screen areas are composed together and what their visual properties are:
Properties of used font styles are stored in the case study in a separate Excel tab, however we imported them in an embedded table to make them available in the section describing the related detailed requirement:
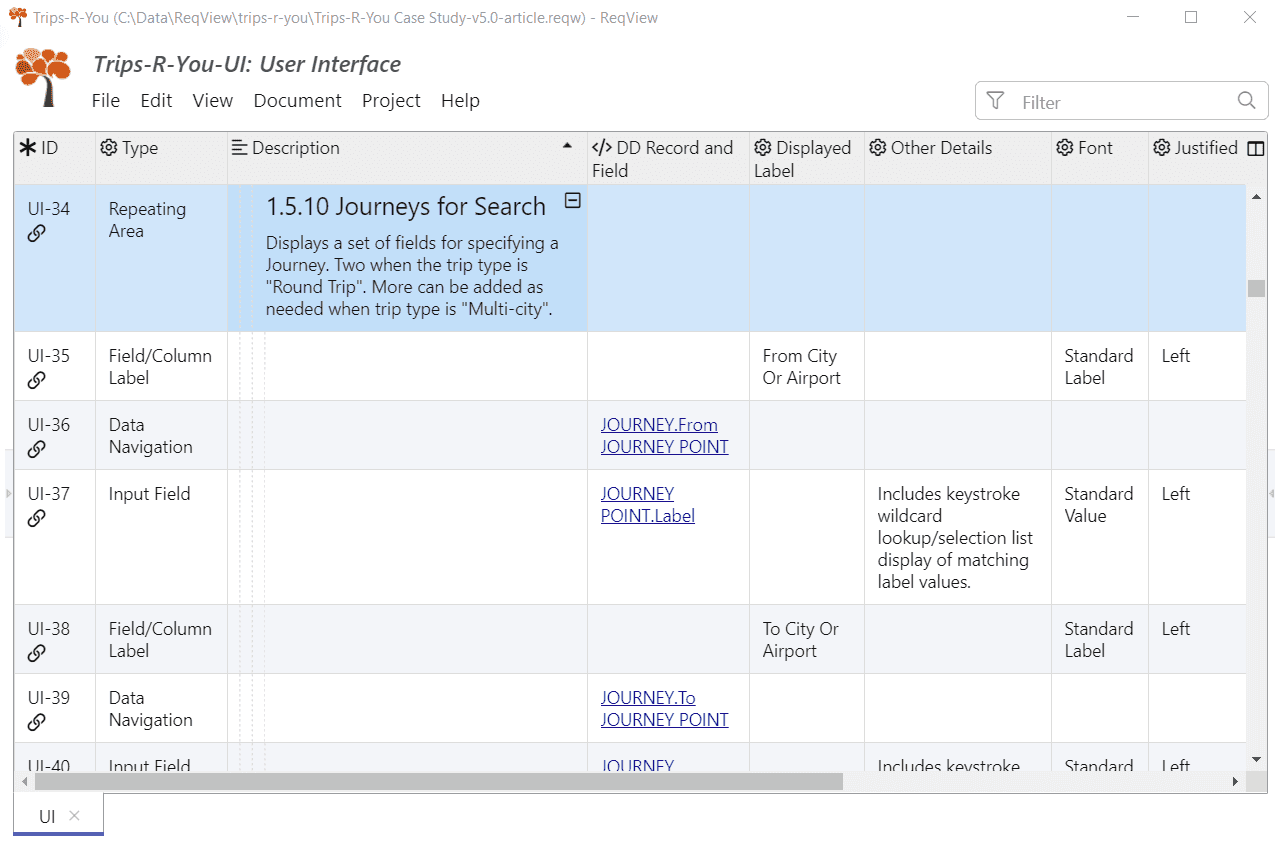
Finally, UI document lists screen areas and their elements representing fields, textual labels, and action triggers:
Traceability Matrix
A traceability matrix is a table storing links between related requirement, design, and verification documents, which are maintained through SW or system development process. The main purpose of the traceability matrix is to demonstrate requirements coverage — that stakeholder requirements were implemented and verified, and to help with change impact analysis before requirements changes are accepted.
Maintenance of a traceability matrix for a larger project in Excel is very time consuming and error-prone. With ReqView you can manage traceability easily by:
- getting requirement IDs assigned automatically so you cannot change them by mistake.
- grouping links by their type (satisfaction, verification, reference, etc.) so you can filter links during traceability analysis
- creating links representing many-to-many relations between selected requirements effectively
- displaying traceability columns listing linked elements grouped by link types
- browsing traceability in both directions by clicking on a links
- adding simple rules and display a warning for requirements with missing or inconsistent links
- generating custom traceability reports to understand requirements coverage across several traceability levels
We set up requirements traceability in the Trips-R-You project as follows:
- Satisfaction links
- High-Level requirements (NEEDS) → business goals (INFO)
- Detailed requirements (UI, REPORTS, EXPORT, IMPORT, AUTO-F) → high-level requirements (NEEDS)
- Definition links
- Detailed requirements (UI, REPORTS, EXPORT, IMPORT, AUTO-F) → data dictionary (DD)
- Reference links
- Between related requirements in the same document
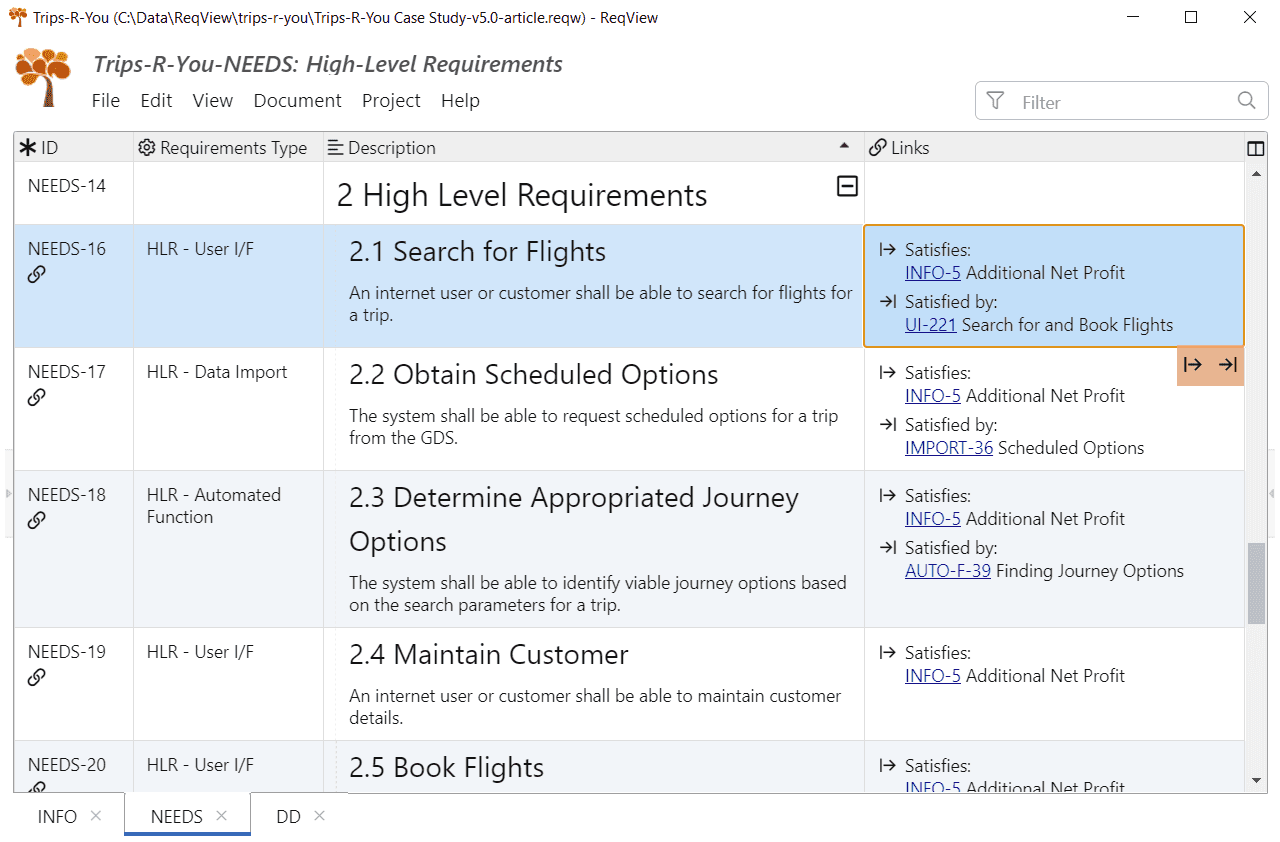
The following screenshot illustrates the content of Links traceability column displaying upstream business goals and downstream detailed requirements for each high-level requirement:
Conclusion
MS Excel is a popular tool for managing requirements because of its simplicity and availability. But business analysts or system engineers reach its limits soon.
By managing requirements in ReqView instead of Excel you get the following advantages:
- get unique identifiers assigned automatically
- organize rows in a tree hierarchy easily
- describe requirements using rich text format and enhance the description by attached diagrams and embedded tables
- manage consistent requirements traceability matrix with minimal effort
- generate requirements traceability reports to analyze requirements coverage
- track changes of each requirement